TileMill
Intro
Tilemill is an open source map design software. It can import GIS data from various sources and lets you design a map based on said data. Tilemill was primarily created for exporting MBTiles-formatted raster images, but can also be used to export single SVG, PDF or raster images. Styling is achieved with CartoCSS, a css-like language which allows users to describe what features should be displayed at what zoom level in what appearance.
This guide explains how to create a poster similar to the following image.

Installation
Download and install TileMill according to the instructions on the website.
GIS data
The easiest way to acquire vector map data is to download them from a German company named Geofabrik. They have a download page where you can download .shp files for various regions of earth. Download the appropriate region and unpack it. The zip folder contains shapefiles for various different features, like water areas, roads and buildings.
Importing layers
- Start and open TileMill in the browser (using
npm start). - Create a new project on the welcome screen. This creates a new project where one layer, containing the shapes of all countries, is imported.
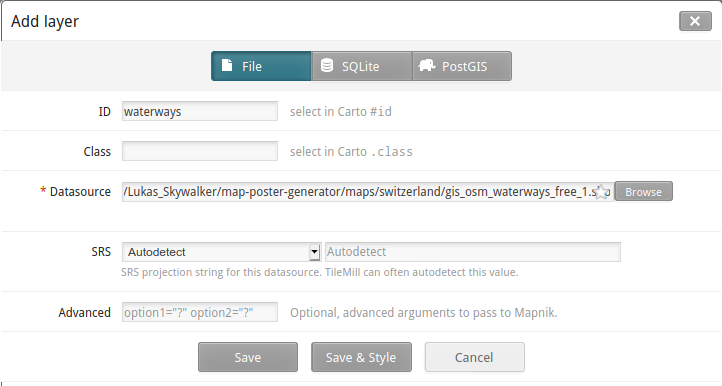
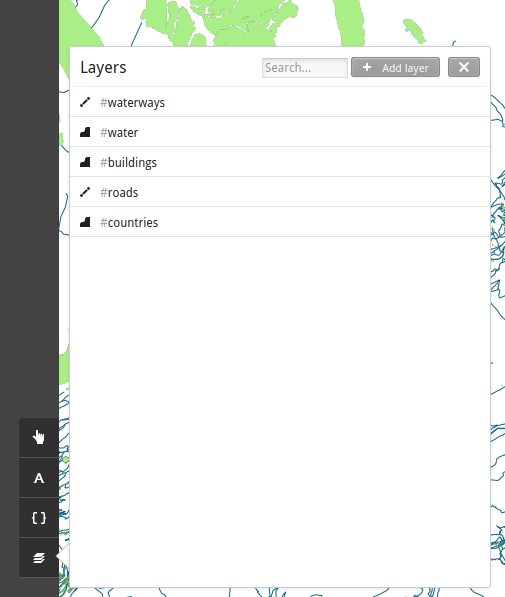
- Add a new layer by clicking the layer icon and “Add Layer”.
- Your layer must be identifiable by ID or class. It is easiest to give the layer an ID describing the content of the shapefile, e.g. “roads” if you choose to import the shapefile of the roads.
- Select the Shapefile as the datasource and leave all other options as they are. Click “Save & Style”.

Styling layers
The layer view should now display all the layers you imported. You can toggle their visibility, delete them or list all contained objects in the layer panel.

The different objects of a layer are usually tagged. The tags contain
information about the road size, the maximum speed, the water depth and
much more. Those attributes can be used to style different types of
objects of the same layer differently. To see all possible attributes
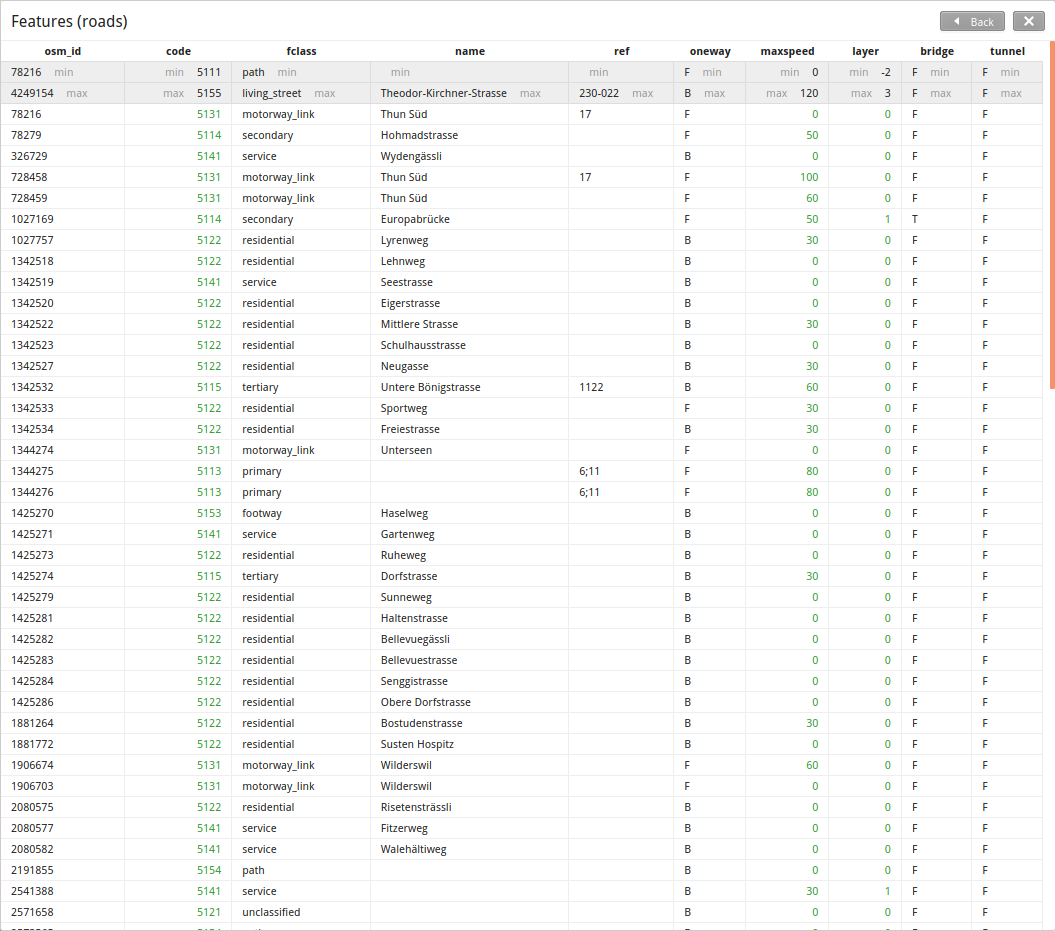
and their values, hover the layer and open the “Features” view. The
table lists all attributes, e.g. fclass for the road size.

If you do not know how a particular feature is tagged, the easiest way to find it is to open the map on openstreetmap.org, find the feature, right-click it and note the OSM-ID (the long number).
With that knowledge, you can run the following command to find the feature in the .shp file, replacing OSMID with your ID:
ogrinfo -al gis_osm_roads_free_1.shp | grep OSMID -B 1 -A 10
This will list all attributes of this feature, so you know how to select it in CartoCSS:
OGRFeature(gis_osm_roads_free_1):1069046
  osm_id (String) = 653190711
  code (Integer) = 5153
  fclass (String) = footway
  name (String) = (null)
  ref (String) = (null)
  oneway (String) = B
  maxspeed (Integer) = 0
  layer (Integer64) = 0
  bridge (String) = F
  tunnel (String) = F
To style a layer, you can enter CartoCSS code in the right pane of TileMill. CartoCSS works like normal CSS, where you can target the attributes of features with the CSS attribute selector:
Map {
  background-color: white;
}

@color: rgb(0, 66, 138);

#roads{
  line-width: 1;
  line-color: transparent;
}
#roads[fclass = "motorway"] {
  line-width: 3;
  line-color: @color;
}
This CartoCSS code hides all roads, but overrides the color for all
roads with the fclass attribute of motorway. The file
style.mss contains a complete example.
Exporting
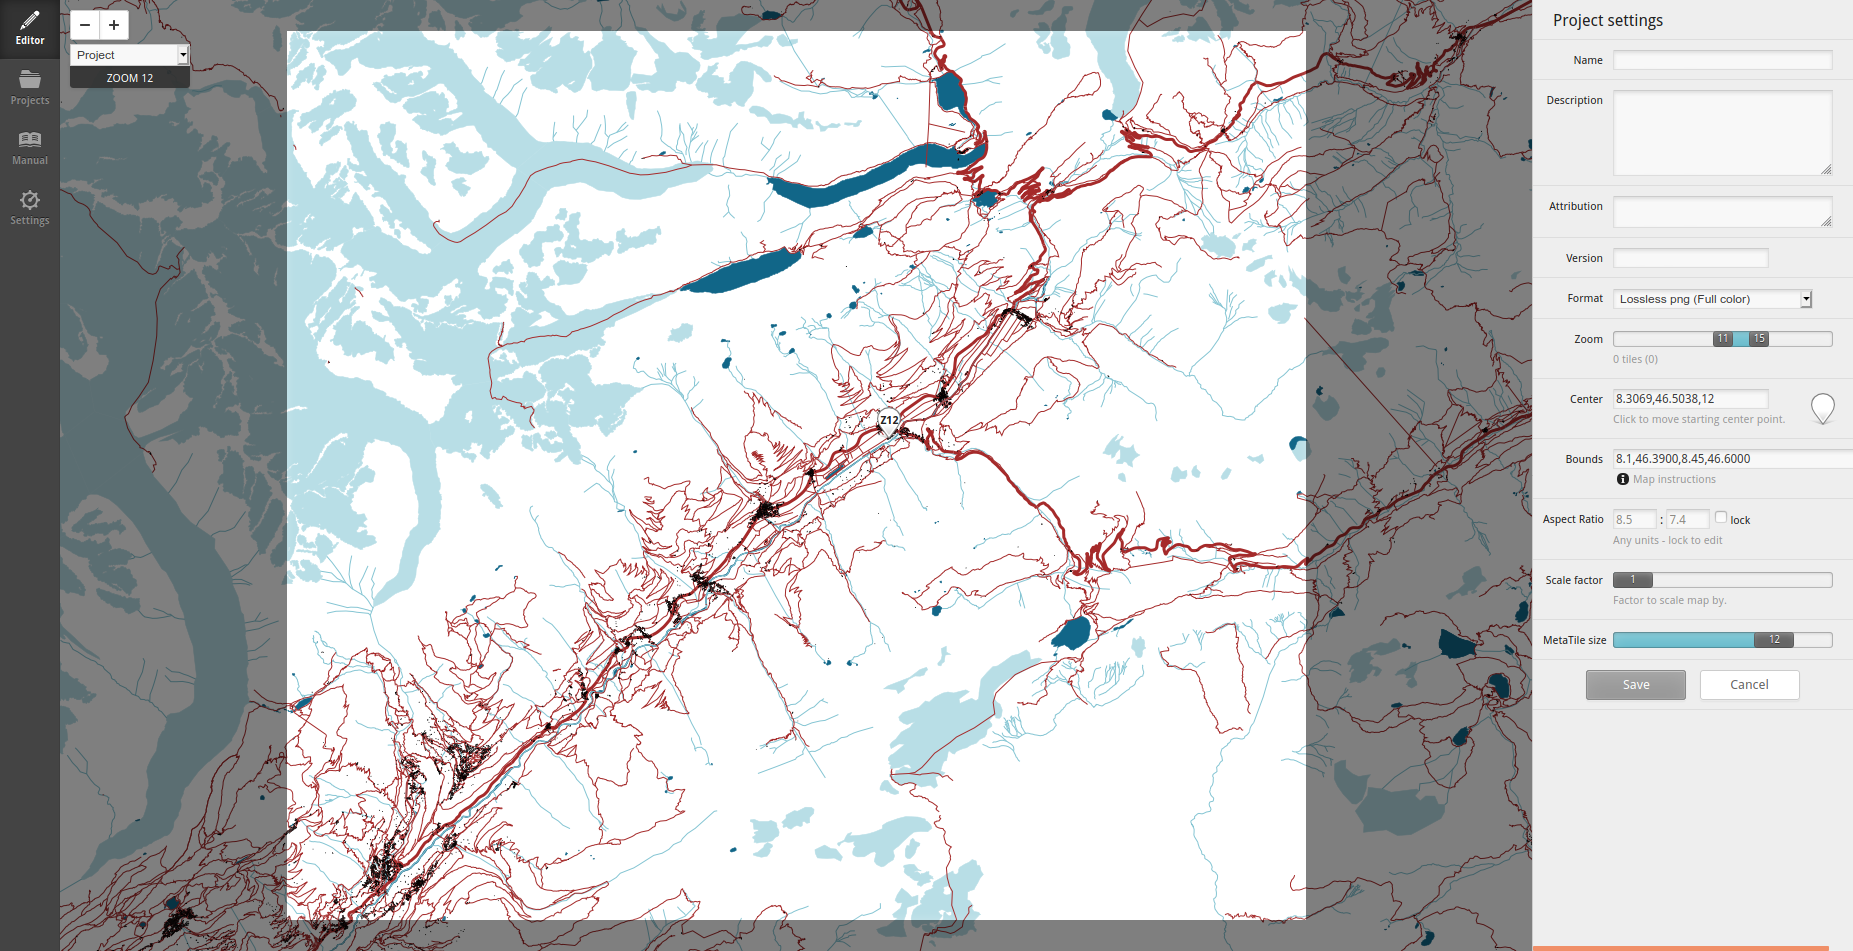
In order to export the map SVG, you must first find the zoom level to export. Open the settings in the top right and zoom all the way out. Then start zooming in on the required area one level at a time. Make sure to wait until the map has loaded until you zoom further. This could take some time.
Once you have reached your desired zoom level, you need to define the map extent. Shift-drag to set the map extent. Save the settings once you are happy.

Click the export button on the top right, and choose the format, size, zoom level and bounds of your export. Make sure the size corresponds to the pixel size of your final poster (e.g. 7016 x 9933px for printing an A1 poster. Then export the file as SVG.
Labelling
The easiest way to add the location label is to open the resulting SVG file in Inkscape and copy an existing template. You can download a template of the finished poster. The original poster uses the “Equal Sans” font by Måns Grebäck which is free for noncommercial use. You can download it from this repo.